What is an infographic?
You see them daily on adverts, online and in brochures and magazines, but what exactly is an infographic? The dictionary definition, states that they are a “visual presentation of information or data, in the form of a chart, graph, or other image accompanied by minimal text, intended to give an easily understood overview, often of a complex subject.”
Whilst not a new thing, the last few years have seen an explosion in their use in marketing materials and it’s easy to see why. An infographic enables us to display this information in an engaging, informative and visually fun way, so our messages stand out in environments already overloaded with information, for example, social media, e-marketing and direct mail.
However, as they become more popular, infographics can lose their impact if overused or used in the wrong context. Here’s our quick guide to using infographic effectively in marketing materials:
![]()
Do:
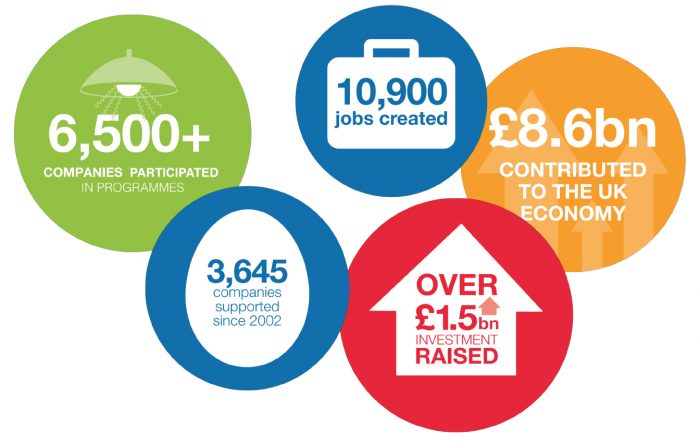
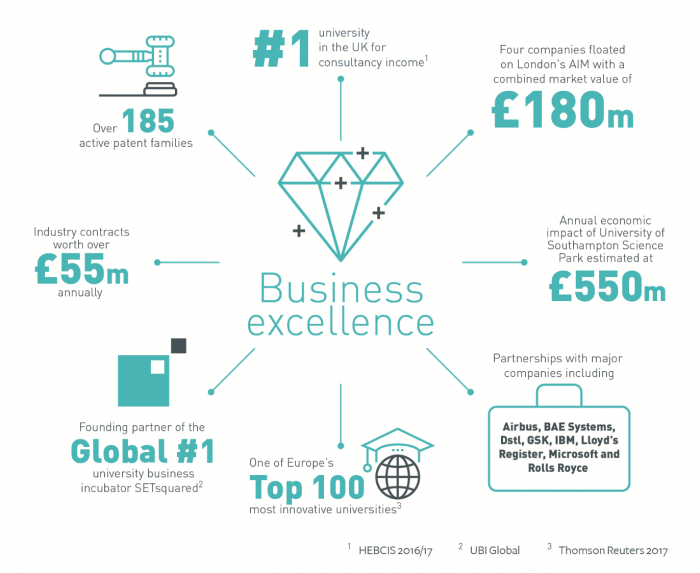
- Tell the story – usually, an infographic piece would contain up to 10 stats and icons as opposed to one individual icon/stat. By bringing this information together in one place you can visually tell a story.
- Keep it simple – the most effective infographics are the simplest designs, they communicate information efficiently and clearly to the target audience. We recommend that each infographic should be made up from one statistic and one icon. Any more and the message gets lost.
- Colours – use of colour enables messages to stand out if you stick to two colours maximum, you ensure the information remains as legible as possible.
- Engage the reader – by using a combination of graphic and statistics you can communicate so much more, at a glance.
- Cherry-pick the surroundings – carefully consider where the infographic is going to be used, whatever surrounds it may detract from it. Surroundings can determine how effectively the information is communicated. For example; text-heavy documents such as annual reports can be a good place to feature infographics as they stand out and can convey a message in a fraction of the time.
- Social media sites – a great place to use infographics, you can display statistics to an audience who can interpret the information quickly.
Don’t:
- Waste an opportunity – steer clear of using infographics on large scale formats eg: billboard adverts where the distance from the audience will make them too hard to read.
- Simply replace an image with an infographic – infographics are much better placed to communicate statistics and data, they shouldn’t take the place of an image. An image can give context and conveys emotions, values and embodies the personality of the piece – all of which an infographic cannot do.
- Go overboard – we would recommend no more than 10 infographics to make up one piece. Anymore and its information overload.
- Overclutter – if you place an infographic on a cluttered background or busy promo piece, your infographic will be illegible and lost. Always use them on a white or one-colour background.